Color
Robert P. Munafo, 2023 Mar 21.
For the purpose of this discussion there are two types of color drawing situations.
"Limited color" refers to the situation where there is some rather small number N of colors available (typically 256 or less) and you specify which color to use by giving a single number from 1 to N.
"Full color" refers to the situation where you specify the color to use by giving three separate numbers, specifying the color in terms of some kind of three-dimensional color space (like red-green-blue, or hue-saturation-luminance)
Limited Color
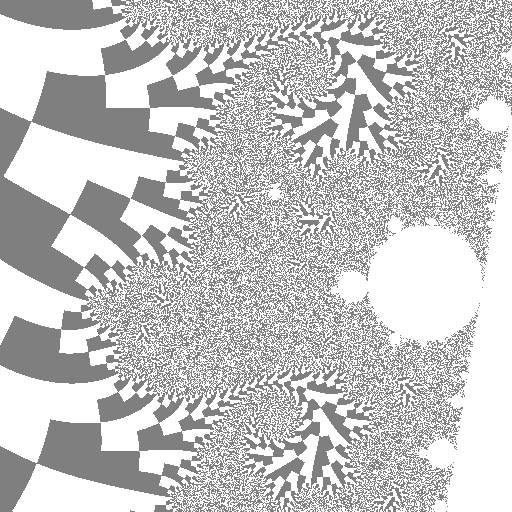
When working in limited color it is typical to pick a color from 1 to N based on the number of escape iterations of the point. If the number of iterations is less than N it can be used directly. If it is bigger than N you can pick a fixed "overflow" value, or use (iterations modulo N), which has the effect of cycling through the colors as many times as needed to cover all the possible iteration values.
Full Color
The best approach when working in full color is to treat your available colors as a two-dimensional or three-dimensional space and plot each pixel with a color that combines different attributes of the iterated point, using dimensions in the color space. There are lots of possibilities; here are two examples:
Two dimensions of color, two attributes of point
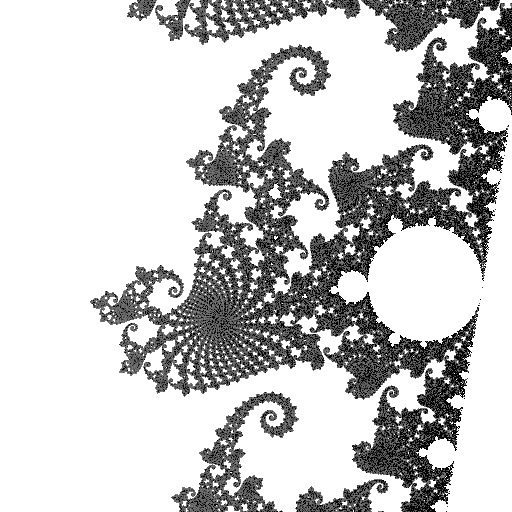
use hue to show Escape Iterations
use brightness to show Distance Estimate
Three dimensions of color, three attributes of point
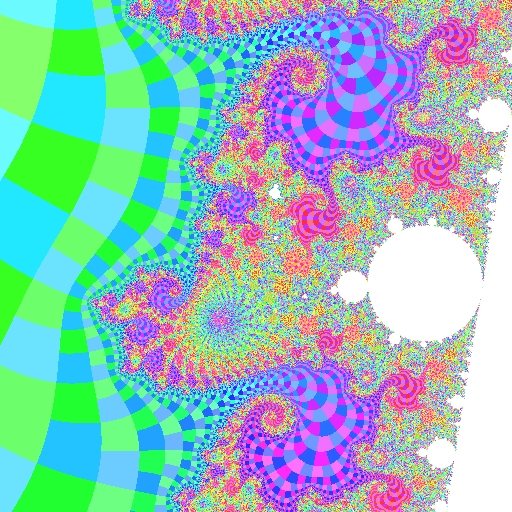
use hue to show Continuous Dwell
use saturation to show final point's Angle
use brightness to show final point's Radius
Both of these will produce fairly stunning results and of course there are dozens of other possible combinations.
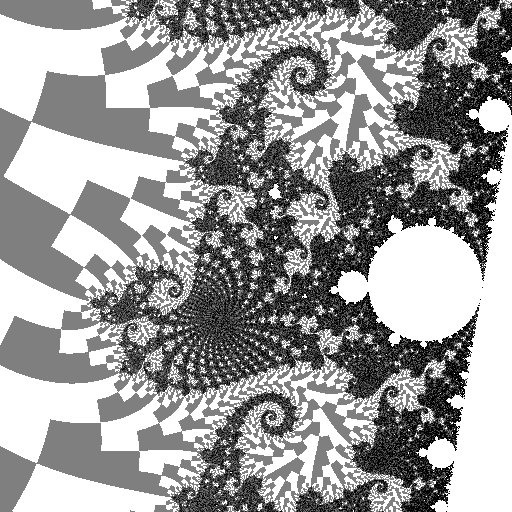
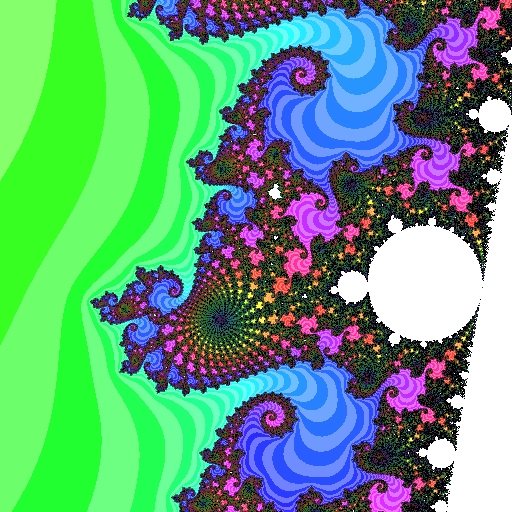
One of the best ways to color the Mandelbrot Set uses the HSV color space. Use the Distance Estimator function for V. Use Escape-Iterations for H, with a somewhat different hue when the final point's Angle is between 0 and pi. Make S alternate between 1.0 and 0.67, to show odd and even values of Escape-Iterations. The result is stunning:

An HSV rendering
(as used in Color MANDELZOOM and its successors)
It is much better to use the hue/saturation/brightness system rather than something like red/green/blue, because of the psychology and physiology of human vision. Most good graphics environments provide a function that converts from HSV to RGB; if your's doesn't, look it up in a book like Graphics Gems or Fundamentals of Interactive Computer Graphics.
For each dimension you want to translate the attribute to the dimension in such a way that you use the whole range, and use it evenly. For example, hue is expressed as an angle on the color wheel. To convert iterations to hue, I would recommend some sort of logarithmic function, so if it takes 20 iterations to go around the wheel the first time, it takes another 40 to go around the second time, then 80, then 160 and so on. Then, to preserve the appearance of stripes at all iterations, you could add 20 degrees to the angle if the iteration is odd. The resulting formula would look like this:
hue = (360 * log2(iterations)) modulo 360 if (iterations mod 2 = 1) hue = (hue + 20) modulo 360

Hue based on iterations
Algorithm Used in the Mu-Ency Illustrations
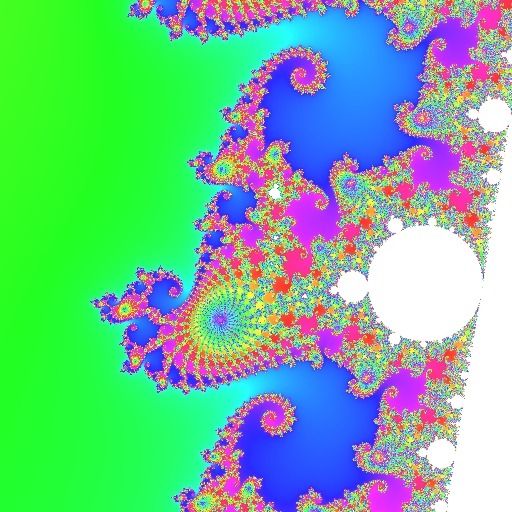
Most of the JPG and PNG images used to illustrate the Mu-Ency articles are colored using an algorithm similar to the following:
using a fairly large escape radius (such as 1000), iterate to determine D using the continuous dwell method (see also escape-iterations) set dwell = floor(D) set finalrad = D - floor(D) (The floor function gives the integer part of D) compute angle of final coordinate of iteration and call it finalang (if the escape radius is big enough, this is also a fractional part of the external angle) compute distance estimate set dscale = log2(distance_estimate / pixel_spacing) if dwell exceeds iterations limit, skip all the following and plot a white point comment Convert the scaled distance estimate to a brightness (called "value" in the HSV color space) from 0.0 to 1.0 in 8 intervals. if dscale > 0 value = 1.0 else if dscale > -8 value = (8 + dscale)/8 else value = 0 comment Apply logarithmic scaling to the dwell. The big number "100000" should be chosen to be bigger than any iterations limit you'll ever use. P = log(dwell)/log(100000) comment The following re-maps the range 0.0...1.0 onto an "angle" and "radius" on the color wheel. This color wheel has white in the center, pastel hues close to the center, and vivid colors around the edge of the wheel. In order to gain maximum use of all the available colors, we compute an angle and radius in a way that places the resulting points equally far apart from one another. The use of square root means that the radius increases more slowly as we move away from the center. Note also that the angle will be multiplied by a constant below, so we'll end up going around the wheel multiple times. if (P < 0.5) { P = 1.0 - 1.5*P angle = 1 - P radius = sqrt(P) } else { P = 1.5*P - 0.5 angle = P radius = sqrt(P) } comment The following makes every other "stripe" a bit lighter if dwell is odd { value = 0.85 * value radius = 0.667 * radius } comment The following breaks the stripes up into "squares" that make the external angles evident. Combined with the previous "stripe" operation, this gives the image a checkerboard-like appearance if finalang > π { angle = angle + 0.02 } comment The following turns each "square" into a rainbow-like gradient angle = angle + 0.0001 * finalrad comment The following causes it to use 10 full rainbows to cover the range from 1 to 100000 (or whichever big number was used in the first step of calculating P) hue = angle * 10.0 hue = hue - floor(hue) saturation = radius - floor(radius) comment hue is now in the range 0.0...1.0. This represents a full circle (normally 0...2π) convert (hue, saturation, value) to (red, green, blue) using standard HSV to RGB mappingThe intended benefits of this algorithm are:
- Always show all of the detail in an image, with lots of contrast
- Always show the dwell bands and binary decomposition
- Does not vary with zooming in and out or with changing the iterations (dwell) limit (in other words, an enlarged portion of any image always matches a recomputed version of just that portion)
- Use a color wheel that is rebalanced to match the human psychovisual color primaries (which gives what I consider aesthetically pleasing colors)
- Makes efficient use of the 3-D color space (for example by compensating for less information-carrying ability at low brightness values)
- Shows multiple hues, except when that would preclude any of the above
More Examples
|
See also algorithms, dithering, palette, representation functions.
revisions: 20100907 oldest on record; 20101213 fix a couple typos; add "intended benefits"; 20221212 add illustrations; 20230321 add continuous dwell illustration
From the Mandelbrot Set Glossary and Encyclopedia, by Robert Munafo, (c) 1987-2024.
Mu-ency main page — index — recent changes — DEMZ
This page was written in the "embarrassingly readable" markup language RHTF, and was last updated on 2023 Mar 22.
 s.27
s.27