Stable Localized Moving Patterns in the 2-D Gray-Scott Model (figures)
These are the mp4 animations from my paper, Stable localized moving patterns in the 2-D Gray-Scott model.
Figures
These are the figures as the author originally intended them. Except as otherwise noted, these are the original images used in the paper.
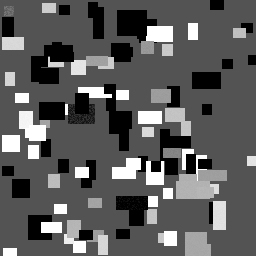 1 a |
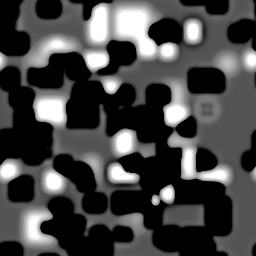 1 b |
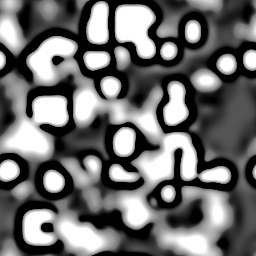 1 c |
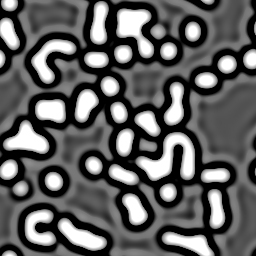 1 d |

2 (converted from TikZ)
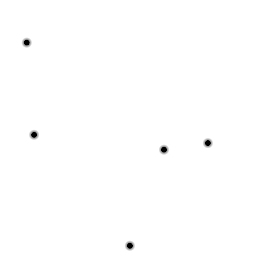 3 a |
 3 b |
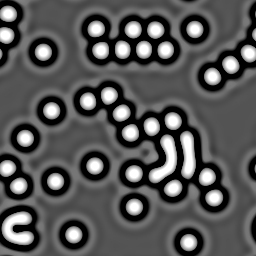 3 c |
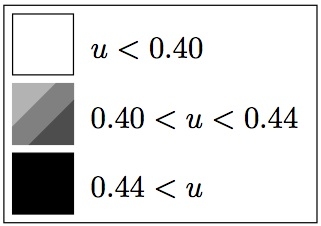
color key (converted from TikZ)
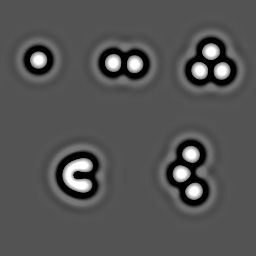 4 a |
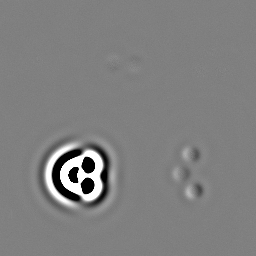 4 b |
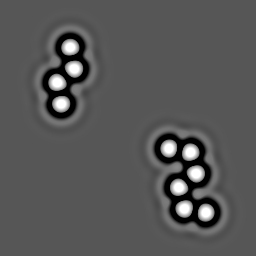 4 c |
 4 d |
 5 a |
 5 b |
 5 c |
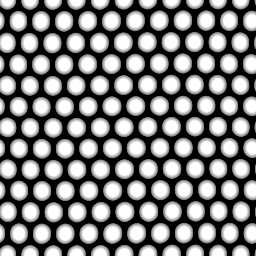 5 d |
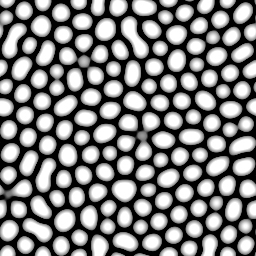 5 e |
 6 a |
 6 b |
 6 c |
 6 d |
 7 a |
 7 b |
 7 c | |
 7 d |
 7 e |
 7 f |
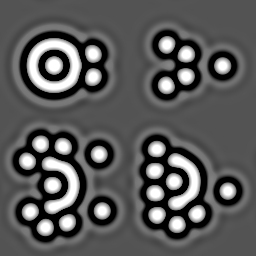 7 g |
More Patterns
There are many, many more stable patterns; I have started this gallery.
Additional Animations
Here are a few animations I produced soon after my discovery of complex behavior in the type π region:
F=0.062, k=0.0609. This is the animation that convinced me I was seeing complexity of a type similar to Wolfram's "class 4" (I describe the Wolfram classes in the context of continuous real-valued systems here.) Rendered on 2009 March 23 at 3:21 AM.
F=0.062, k=0.0609. This was rendered just after I discovered the small U-shaped moving pattern. March 23, 2009 at 3:25 AM EST
This is a very small region of the parameter map; a complete parameter map serves as the main image on this page. This view is centered on (F=0.062, k=0.0609), with F ranging vertically by ±0.002 and k ranging horizontaly by ±0.0001. This movie was made to map out how far "east" and "west" the moving U-shaped pattern is viable. I eventually decided to focus my search on F=0.06, k=0.0609, which is near the bottom-center of this view.
F=0.062, k=0.0609. Time-lapse rate increases progressively, doubling in speed every 7 seconds. First we see normal growth of blue spots to mostly fill the space, and some stripes shrink to yellow spots. Remaining stripes gradually bend and start to create parallel features by 1:00. At about 1:15 stripes begin to transition in complex ways, exhibiting a combination of order and apparent chaos. Note the sudden cessation of activity at 1:29. The final pattern continues to drift due to its asymmetry; rotation is prevented by the toroidal geometry of the system. The drift is extremely slow when viewed at a more normal speed.
Website
The paper also references this exhibit of images and animations from the rest of the Gray-Scott parameter space.
Back to: Papers — Research main